Contrast agent aided localisation of transport tissue in canola
- 1. University of Würzburg, Experimental Physics 5, Würzburg, Germany
- 2. Leibniz Institute of Plant Genetics and Crop Plant Research, Heterosis, Gatersleben, Germany
- 3. MRB Research Center for Magnetic-Resonance-Bavaria, Würzburg, Germany
Introduction: Silique plays a key role in seed development by providing mechanical support and protecting seeds from pests and pathogens. The main resource transport into the seeds occurs via the silique. The photosynthetically active silique in Brassicaceae plants contributes assimilates and nutrients to fuel seed growth [1] . Understanding how the vascular network is arranged and how the reallocation of water and metabolites work, could help maximize overall yield. In the following an in vivo method is presented which allows to detect the active vascular strands via MR contrast agent and is independent of the flow rate in the plant.
Subjects and Methods: Pods of the canola were fixed in a glass tube with the branch placed in liquid culture medium. Tubing was attached to inject a contrast agent without interfering with the setup. The tube was placed in a 20 mm custom-built birdcage coil. A Bruker Avance 750 17.6T NMR scanner was used for imaging. For determining T1 multiple Spin-Echo images with varying repetition times were used for T1-mapping (TE 4.5 ms, FoV 7.5 x 7.5 mm², Matrix 128 x 128, Res. 59 µm isotropic, 2 averages). During the measurement GdCl3 was added to the water to show the accumulation of the contrast agent and its concentration in the plant tissue on a reasonable timescale. The experiment was repeated 19 times giving a total observation time of about 48 hours. Via sliding window analysis the time resolution for a T1 mapping is roughly 15 mins.

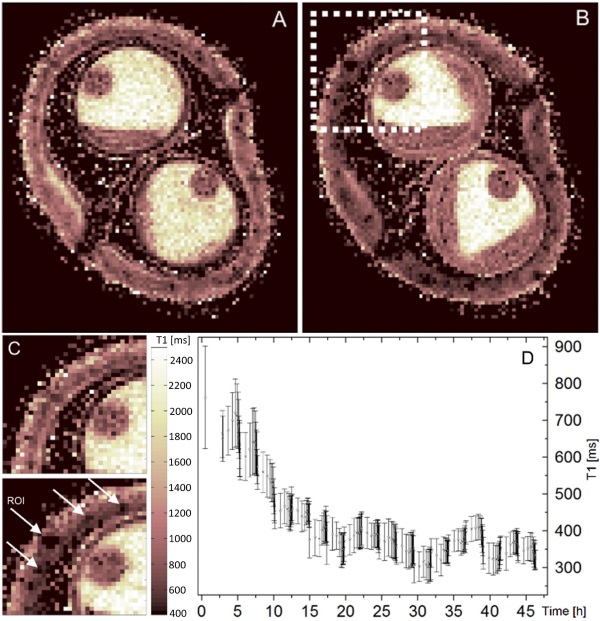
Results and Discussion: Comparing Fig. 1 (A) and (B), one can see a distinct difference in the T1 parameter of the silique's tissue. The contrast agent is accumulating in the pod's active transportation tissue decreasing T1 in this area (C). Starting from the vascular bundles the contrast agent is spreading in the surrounding tissue. Taking a closer look on the active vascular strand gives the T1 decrease over the course of the experiment (D). After approximately 15 hours the T1 value in the ROI has reached its minimal level.
The micropylar region of the seed coat contains a vascular system believed to be participating in nutrient transport into the developing seed. According to our data, contrast agent does not enter the seed endosperm, indicating a controlled nutrition transportation.
Conclusion: The presented method gives a simple technique to observe transportation of contrast agents in a living plant, independent of flow velocities. Thus the method allows to define active tissues involved in solute translocation within the silique.
