Flow-MRI of microfluidic reactors
- 1. RWTH Aachen University, Institut für Technische und Makromolekulare Chemie, Aachen, Germany
- 2. RWTH Aachen University, Aachener Verfahrenstechnik, Aachen, Germany
- 3. RWTH Aachen University, DWI - Leibniz-Institut für Interaktive Materialien e.V., Aachen, Germany
In conventional reactors the surface-to-volume ratio limits the capability of performing solid-state catalysis on the reactor walls. Overcoming this, microfluidic reactors offer several advantages over conventional reactors such as compact design. [1] To improve the reaction conditions it is crucial to analyse the flow within the reactor. This is done in this work by flow-MRI utilizing the flow-imaging employing single shot encoding (FLIESSEN) [2] and spin echo velocity imaging (SEVELIM) sequences.
The microfluidic reactor studied in this work has been 3D-printed with dimensions of 56 x 28 x 11 mm3 incorporating five channels (channel diameter approx. 0.848 mm). The channels are sealed with an exchangeable glass plate suitable for catalyst immobilization.

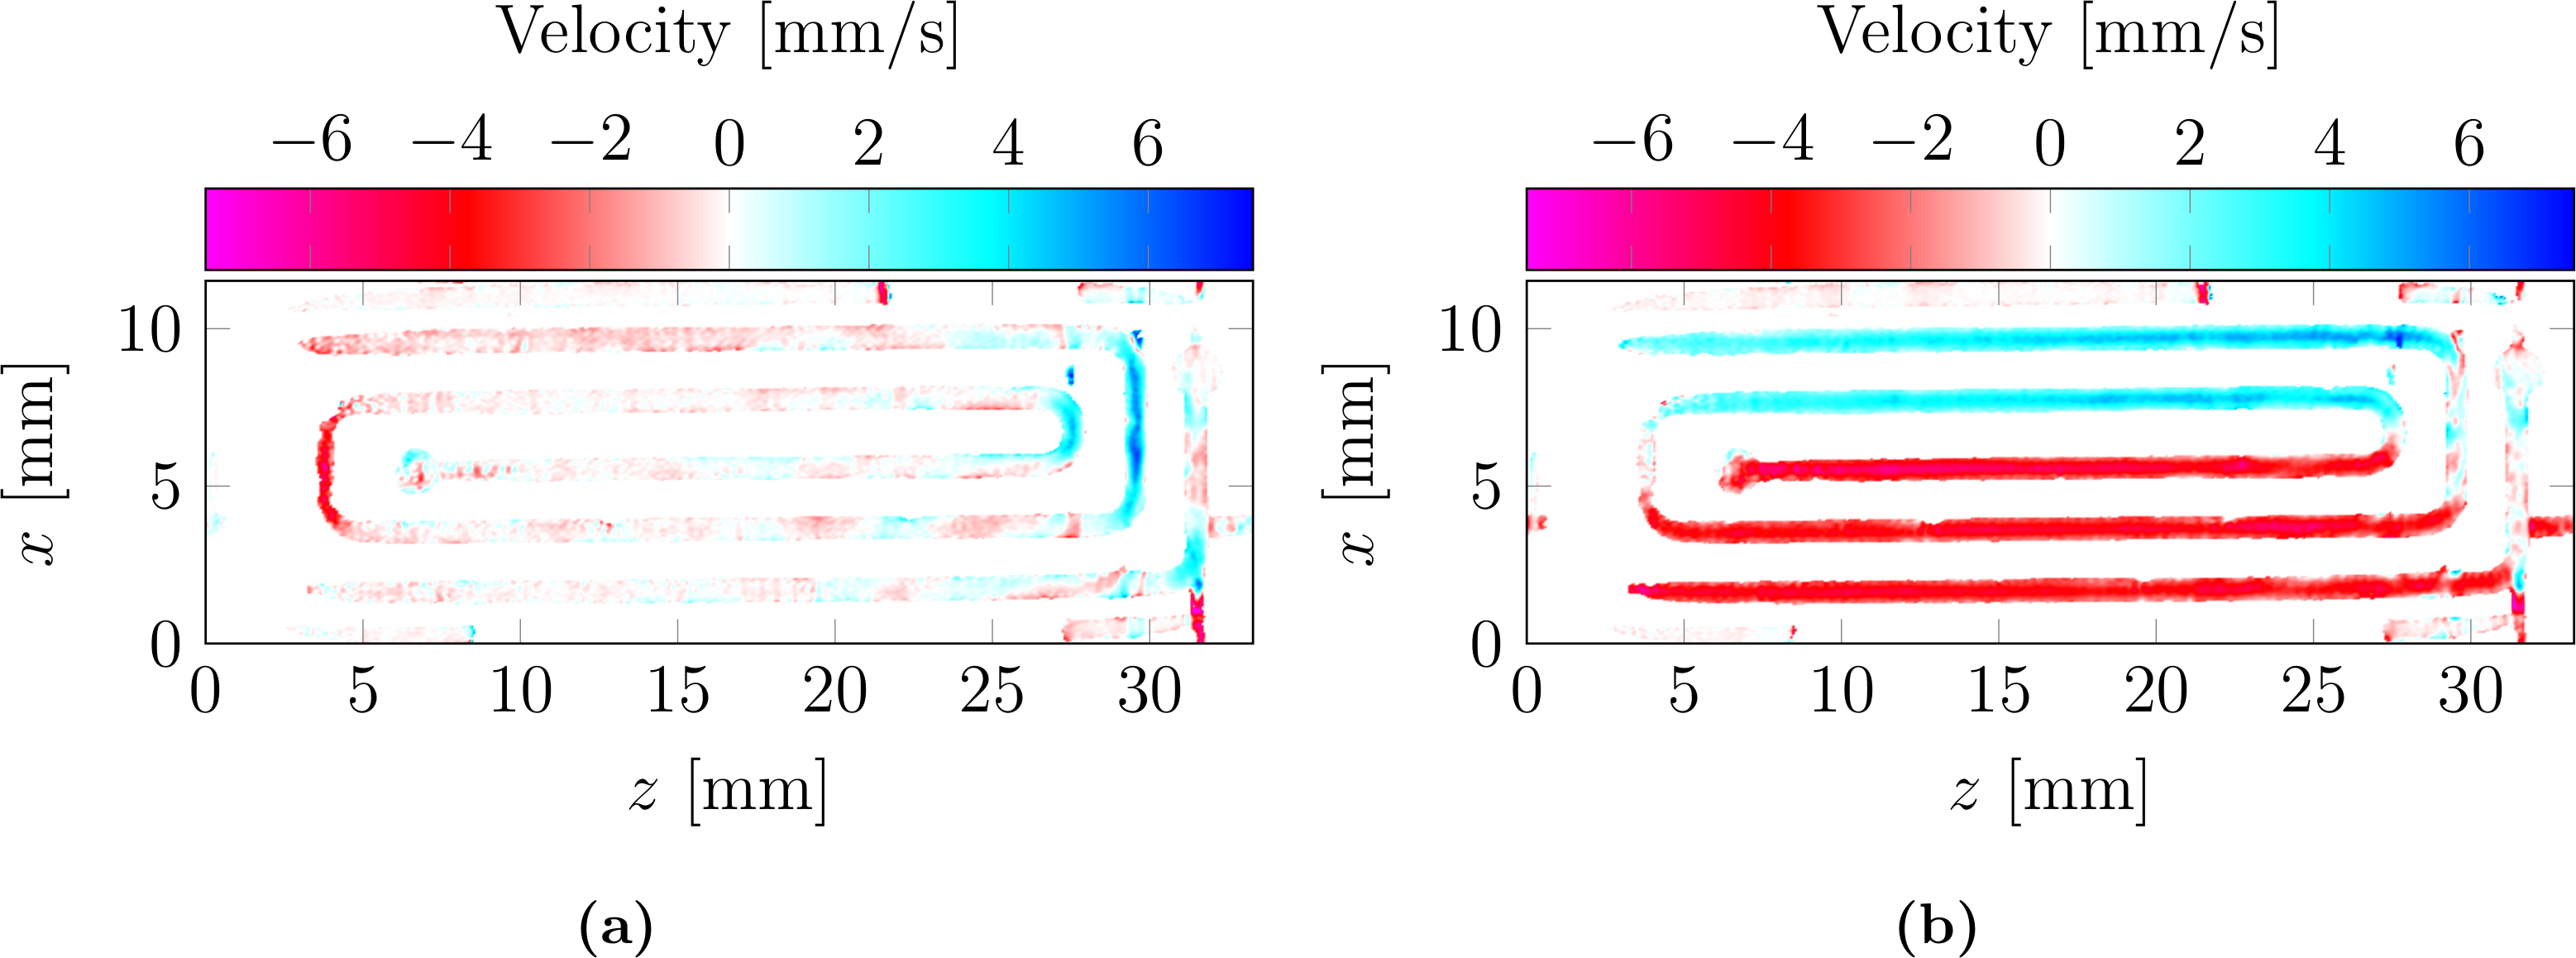
Velocity maps of water flowing through the reactor with 5 mL/h are shown in Figure 1. These were measured with the FLIESSEN sequence in an AV300 magnet with a Micro 2.5 gradient system with a maximum gradient strength of 1.57 T/m. The resolution is 130 x 90 μm2 with a Field-of-Flow of 20 mm/s and a slice thickness of 3 mm. The observed velocity distributions in the channels are shaped parabolic corresponding to laminar flow.

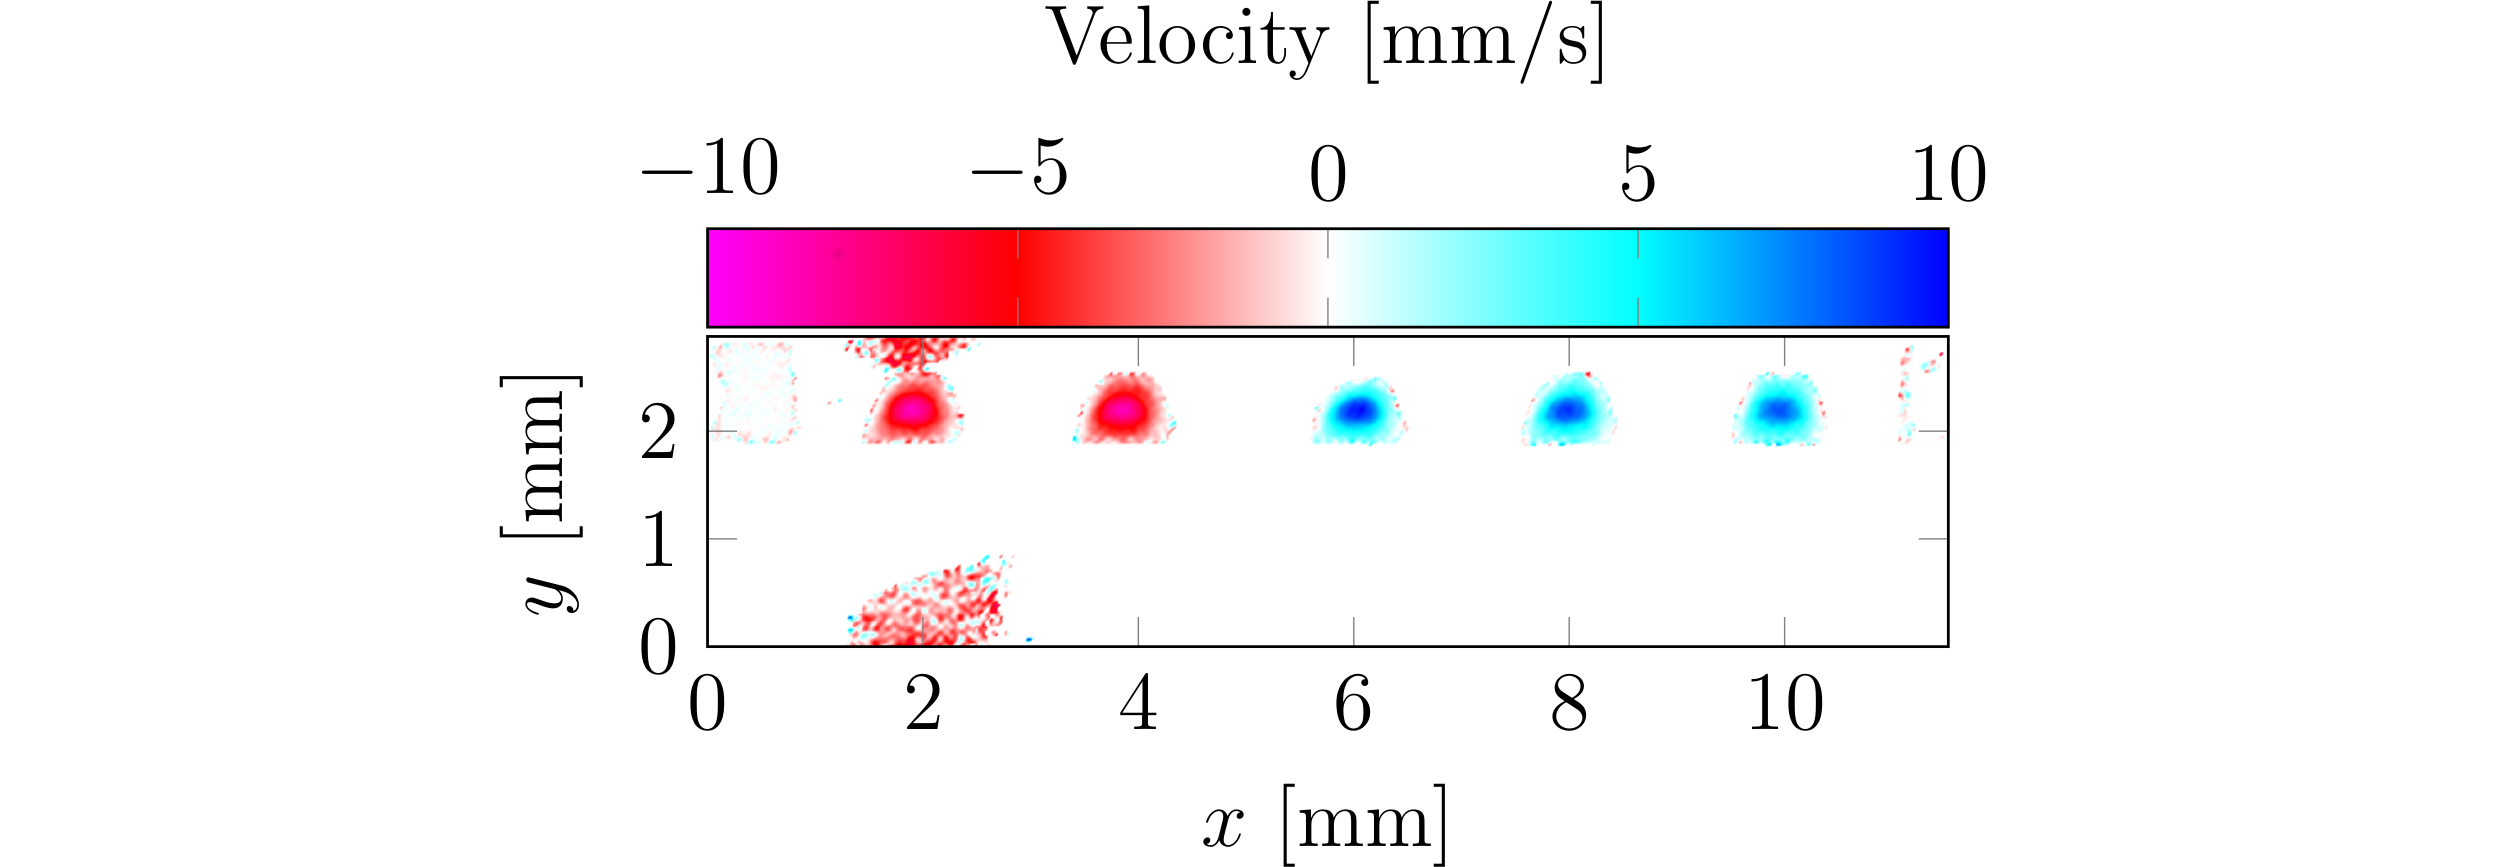
In another orientation the velocity field in the channel cross section can be measured. The image was shot with the SEVELIM sequence with a slice selection of 7.5 mm (Figure 2). This figure shows the distorted half-circular shape of the channels along with the distribution of the z-velocities within them. The velocity is highest in the middle of the channel. Comparing the ratio of maximum and mean velocities within each channel leads to a ratio of 2.57 ± 0.12. The ratio is higher than the ratio of two for tubular flow in circular geometry. In summary, the presented microfluidic reactor shows distorted laminar flow.
- [1] J. Kobayashi, Y. Mori, K. Okamoto, R. Akiyama, M. Ueno, T. Kitamori, S. Kobayashi, (2004), A microfluidic device for conducting gas-liquid-solid hydrogenation reactions, Science, 1305-1308, 304 (5675)
- [2] A. Amar, B. Blümich, F. Casanova, (2010), Rapid multiphase flow dynamics mapped by single-shot mri velocimetry, ChemPhysChem, 2630-2638, (11)
