Predicting drug release from solid pharmaceutical dosage forms using quantitative multi-nuclear (1H- 19F) magnetic resonance micro imaging
- 1. University of Cambridge, Chemical Enginerring & Biotech, Cambridge, United Kingdom
- 2. University of Copenhagen, Department of Pharmacy, Copenhagen, Denmark
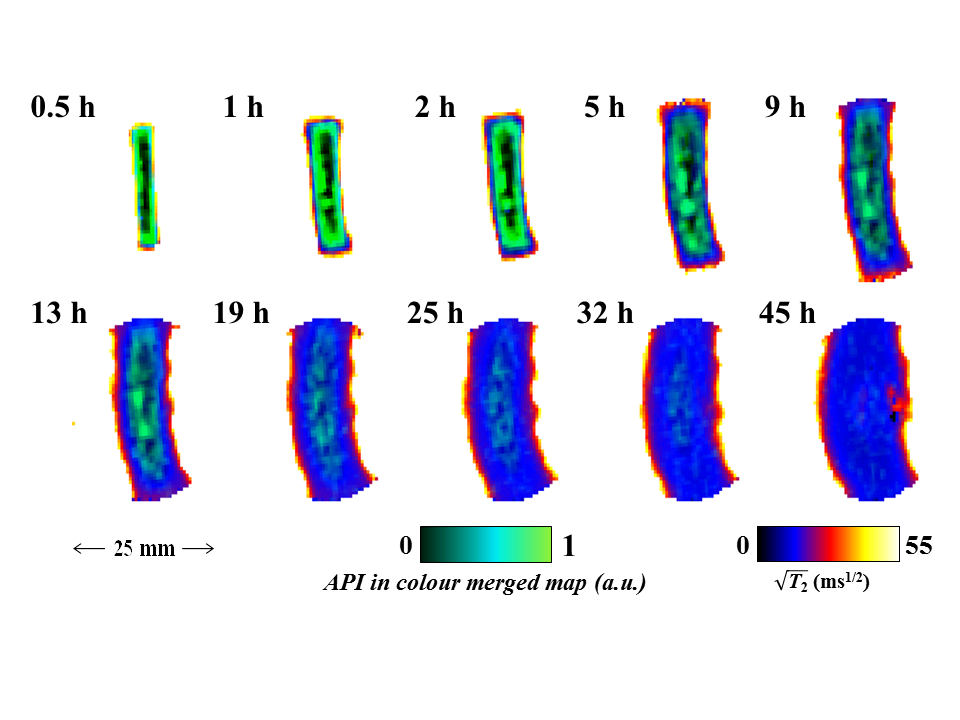
This paper presents our recent work concerning the application of quantitative 1H RARE imaging, 19F radial FLASH imaging and simple 1H/19F profiling to study: (i) controlled release drug delivery devices during dissolution testing in a MRI compatible USP-IV dissolution cell under pharmacopeial conditions and; (ii) non-swelling silicone elastomer based materials pre-loaded with active pharmaceutical ingredient (API) via solvent uptake. For (i), quantitative maps of absolute water concentration, T2 relaxation time, water self-diffusivity, D, and dissolution cell hydrodynamics maps can be obtained in less than three minutes each, allowing a thorough overview of the tablet dissolution process. For hydroxypropylmethyl cellulose (HPMC) polymer based tablets containing the antipsychotic trifluoperazine dihydrochloride (TDFH) API, correlations between water concentration maps and spin-spin relaxation time maps allow us to quantify and visualise the separation of the dry polymer core, swollen glassy layer and gel layer of the swollen HPMC/TDFH compact. In addition to the 1H RARE studies, 2D 19F FLASH techniques with radial sampling of k-space were used to obtain images of the distribution of the 19F containing API during dissolution of the same samples. Figure 1 shows that the co-registration of the API via the 19F TDFH map and polymer mobility via the water 1H T2 relaxation time maps allows us to visualise the API egress and water ingress into the polymer matrix simultaneously; thus API diffusion and distribution can be tracked unambiguously with regard to the evolving gel structure of the tablet.

