Outdoor flow measurement of a living tree using a 0.2 T permanent magnet
- University of Tsukuba, Institute of Applied Physics, Tsukuba, Japan
Technological developments in plant MRI have enabled the investigation of water dynamics in intact trees. However, in situ measurement of growing trees in outdoors still remains a challenge. Recently we have developed an MRI system with a 0.2 T permanent magnet for outdoor measurement of a living tree [1]. We found that the ADC values changed depending on the times, days, and the environmental indicators, which would reflect variations in water transport. Here we performed more direct, in situ flow measurements using q-space imaging, which would enhance our understanding of water dynamics in relation to the tree physiology.
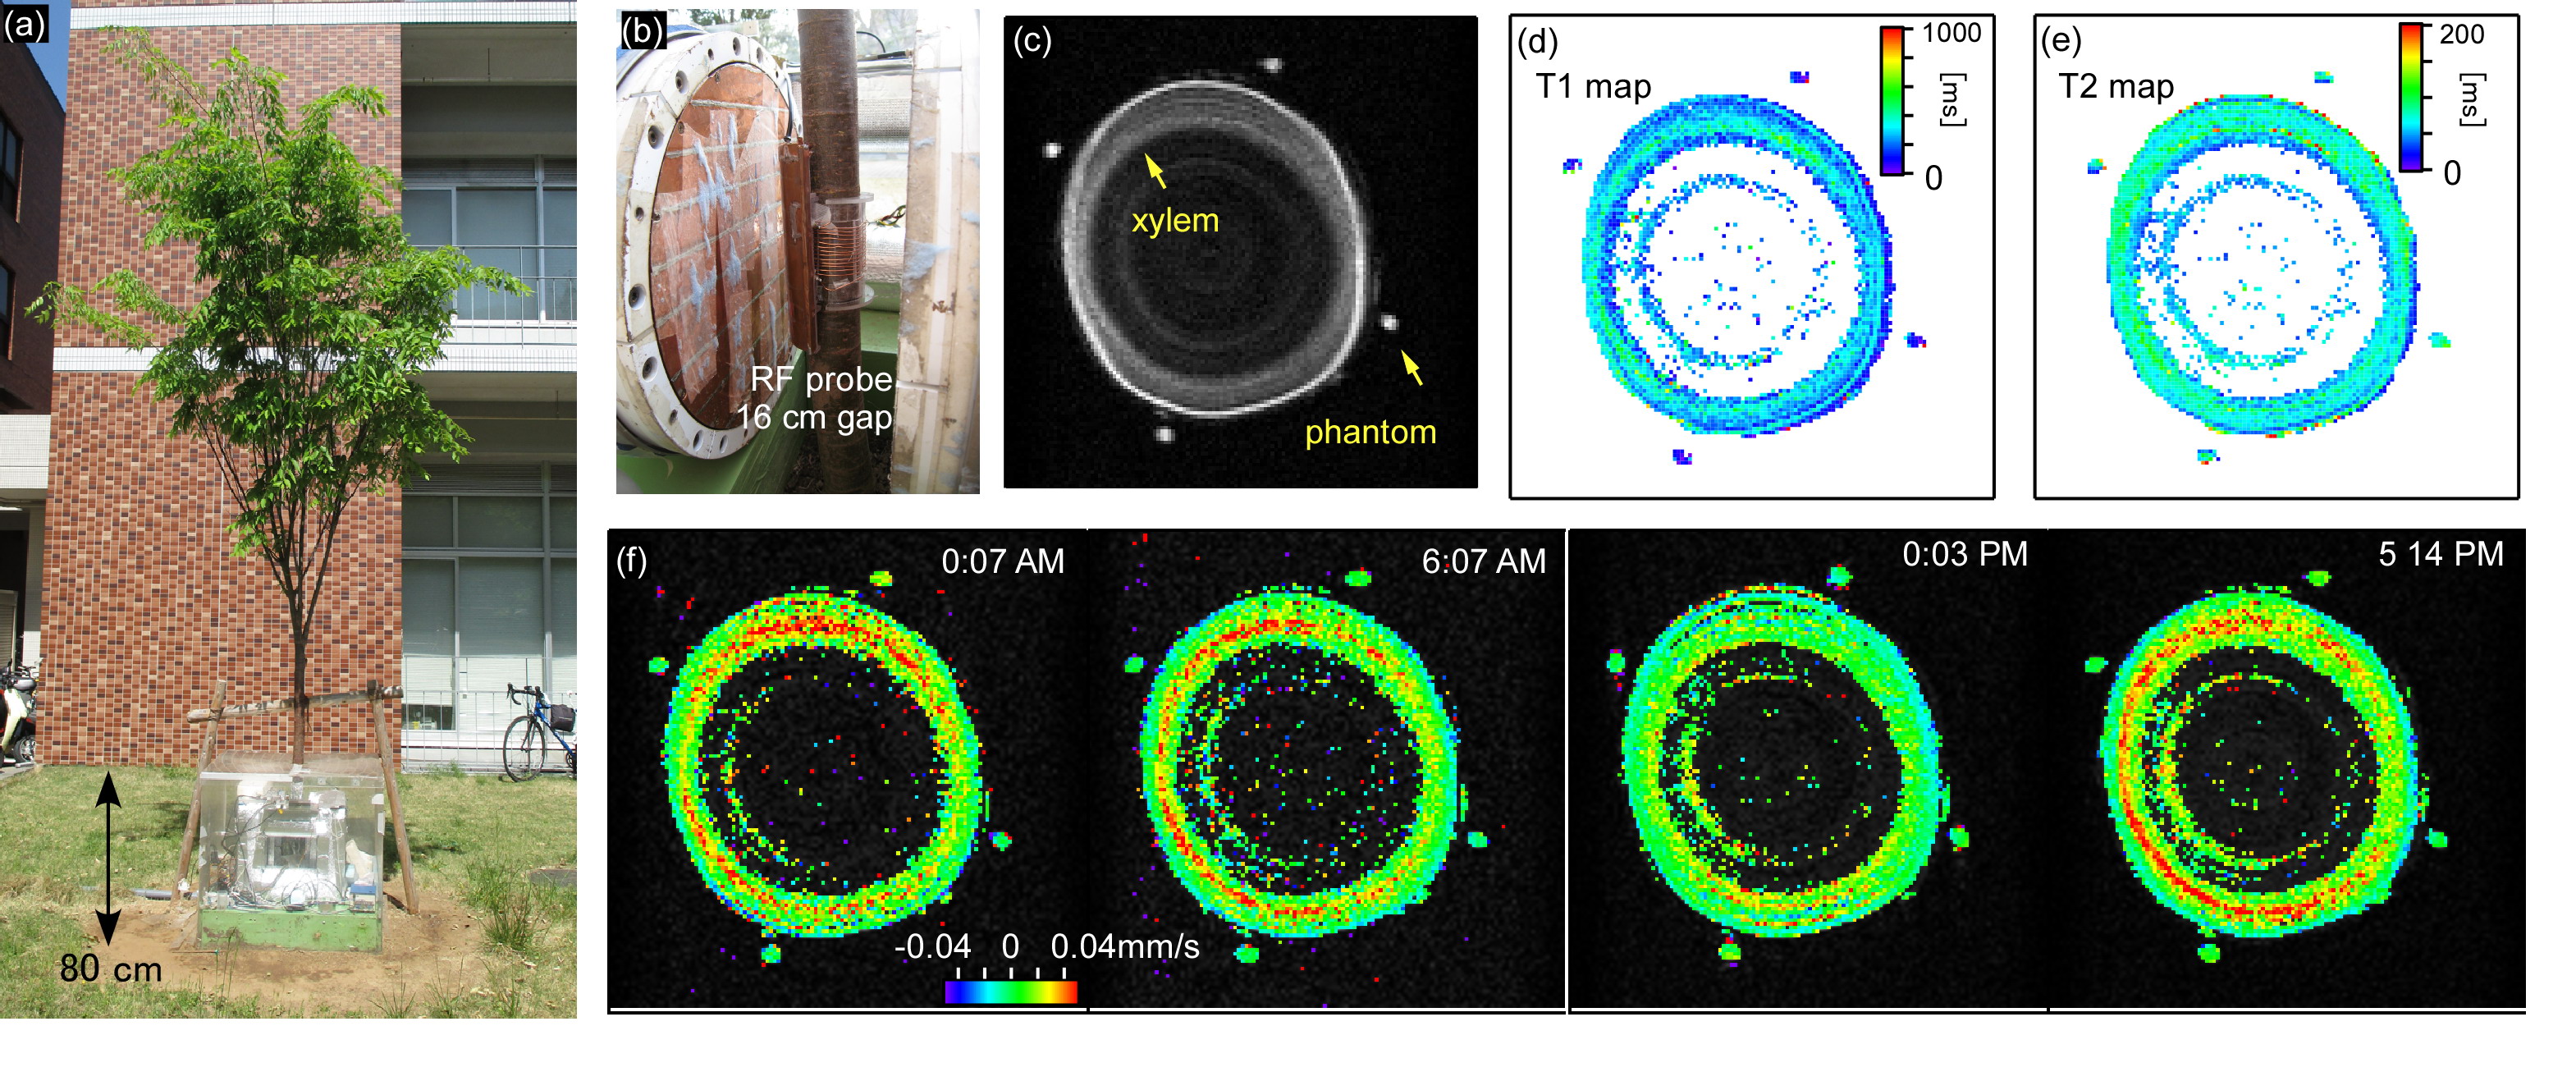
The MRI system (Figs. 1(a) and (b)) consists of a 0.2 T with a 16 cm gap permanent magnet (520 kg), planar gradient coil set, solenoid RF probe (7 cm in diameter, 6 cm long, 12 turn), and MRI console. The system was waterproofed by a box made of acrylic plates. The magnet temperature was kept almost constant by silicon heaters and heat insulators. The efficiency for x (vertical direction), y, and z (B0 direction) gradients was, 6.76, 1.23, and 2.62 mT/m/A, respectively. A flow in the trunk of a Zelkova serrate at 40 cm above ground was measured using pulsed field gradient-stimulated echo (PFG-STE) sequences (TE/TR = 40 ms/800 ms, slice = 4 cm, NEX = 4, Matrix = 128 × 128, FOV = 10 cm × 10 cm, δ = 10 ms, and Δ = 100 ms). For flow calibration, four oil phantoms were placed around the trunk (Fig. 1(c)). The amplitudes of the PFG pulses were changed from -33.8 to 33.8 mT/m at intervals of 4.23 mT/m, corresponding to qmax=1.44×10⁴m-1 and Δ q = 1.80×10³m-1. The flow velocity was calculated on a per-pixel basis as follows [2]. The calculated propagator was subjected to a least-squares fit to a Gaussian function, and the mean displacement < r > was derived. The flow velocity was derived from the equation < v > = < r >/Δ.
The anatomical structures in the trunk were visualized in the STE, T1 and T2 images (Figs. 1(c)-(e)). The xylem was clearly distinguished as the region with the high water content and long relaxation times. The flow maps (Fig. 1(f)) show upward-flowing xylem sap, which was fast compared with the other regions. The flow maps showed little diurnal variation, possibly because the leaves were relatively small and sparse at the beginning of the growing season. The flow would get faster in the later season and the temporal variations could be measured. The results would demonstrate the potential of our flow-imaging methods.

- [1] Y. Terada, A. Fukita, S. Moriwaki, and K. Kose, (2013), In situ living tree measurements using a 0.2 T permanent magnet, ICMRM12, 79
- [2] T. W. J. Scheenen, F. J. Vergeldt, C. W. Windt, P. A. de Jager, and H. Van As, (2001), Microscopic Imaging of Slow Flow and Diffusion: A Pulsed Field Gradient Stimulated Echo Sequence Combined with Turbo Spin Echo Imaging, Journal of Magnetic Resonance, v151, 94
